Jem Berry
The oboe used in this experiment was copy of a Stanesby Sr made by a well respected maker (not me!). A laptop computer and software was used for two functions:
-
- A tone generator programme was used to generate a sine-wave tone at the required frequency. This was fed into the bore using an old earphone as a speaker and a specially made staple equivalent to the acoustic volume of the usual reed. The oboe was ‘fingered’ using Blue-Tack. If the frequency of the sine wave tone was appropriate to the fingering (e.g. 415Hz or 830Hz for an A fingering) then the air column in the bore resonated producing a standing wave and an audible ringing tone (quite unlike a normal oboe tone because it comprised only one harmonic).
-
- The loudness of the tone was measured using a lap-top microphone fitted to the end of a long thin brass tube (same principle as a stethoscope). This tube was inserted into the bore from the bell end. The resulting signal was analysed using a frequency spectrum analyser and the computer’s soundcard (it would probably work using any old device to measure the strength of the signal, but the analyser programme made it easy to exclude extraneous noise). The height of the single peak at the driven frequency was recorded at 5mm intervals as the tube was introduced further into the bore. The resulting measurements were plotted against bore position using MS Excel.
The signal generator and frequency spectrum analyser were accurate to a fraction of one Hz. The microphone and speaker were non-linear, and so while frequency and positions are accurately measured, the amplitude (height) of the peaks is relative only. It is quite likely that the peaks would fall in slightly different positions in a normally blown oboe (anyone able to hold an A for 20 minutes?)
This is the microphone and probe:
 Standing wave measuring device
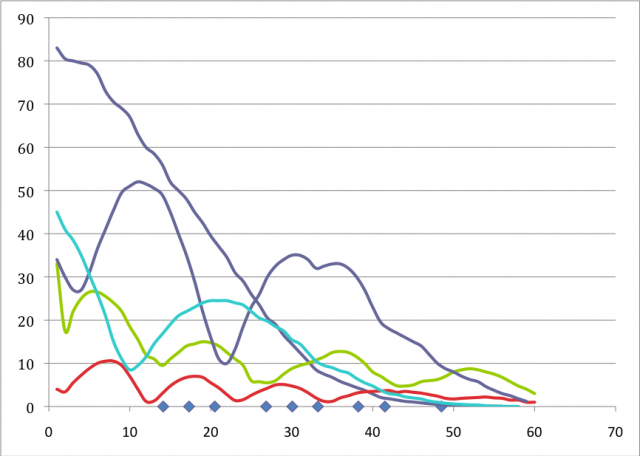
The following diagram shows directly measured standing waves of the first 5 harmonics of a Stanesby Sr oboe copy fingered for E. The position of the nodes (troughs) and antinodes (peaks) relative to the bore of the instrument are shown along the horizontal axis. ‘0’ represents the top of the instrument (so the ‘probe’ is actually just inside the staple at this point), and the distance from the top is shown in cms. Finger hole positions are shown as blue diamonds.
 Standing waves for E’
Note how far the standing waves extend beyond the first open tone hole. It is this phenomenon which ensures the effectiveness of cross-fingerings. Note also how the peaks are higher and displaced closer to the top of the instrument (the antinode of the first harmonic is well within the staple and beyond the reach of the microphone probe). This may explain why small changes in the upper bore and staple can have such marked effects.
The increased amplitude of the peaks towards the top of the instrument is due to the conical bore, and is not due to increased proximity of the microphone to the sound source. This can be demonstrated by using a non-resonating frequency when the amplitude of the signal in the bore does not approach that of the resonant frequencies. The general shape of these curves is exactly that predicted in the literature by calculation
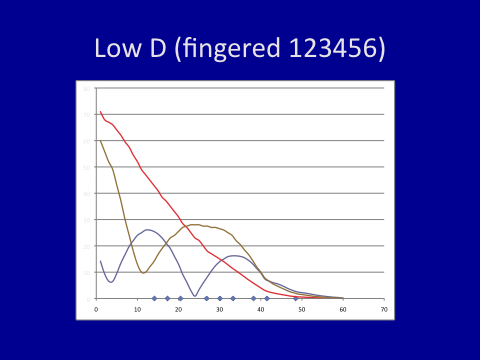
For comparison the standing waves for the first three harmonic frequencies of D are given below:

Standing waves D’
I’ve chosen the low fundamental notes above because they use most of the bore and it is possible to plot several harmonics. Strange things happen with higher frequencies of higher notes, probably because of the cut-off frequency above which sound waves are not reflected back up the bore.
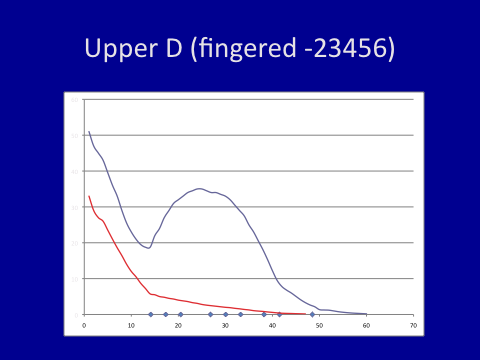
This set-up can be used to demonstrate other phenomena. For example, when the first finger is raised to play upper D the first harmonic ‘collapses’, but the second harmonic is unaffected because the open first tone hole falls on a pressure node (trough), thus favouring the second harmonic:

Standing waves D”